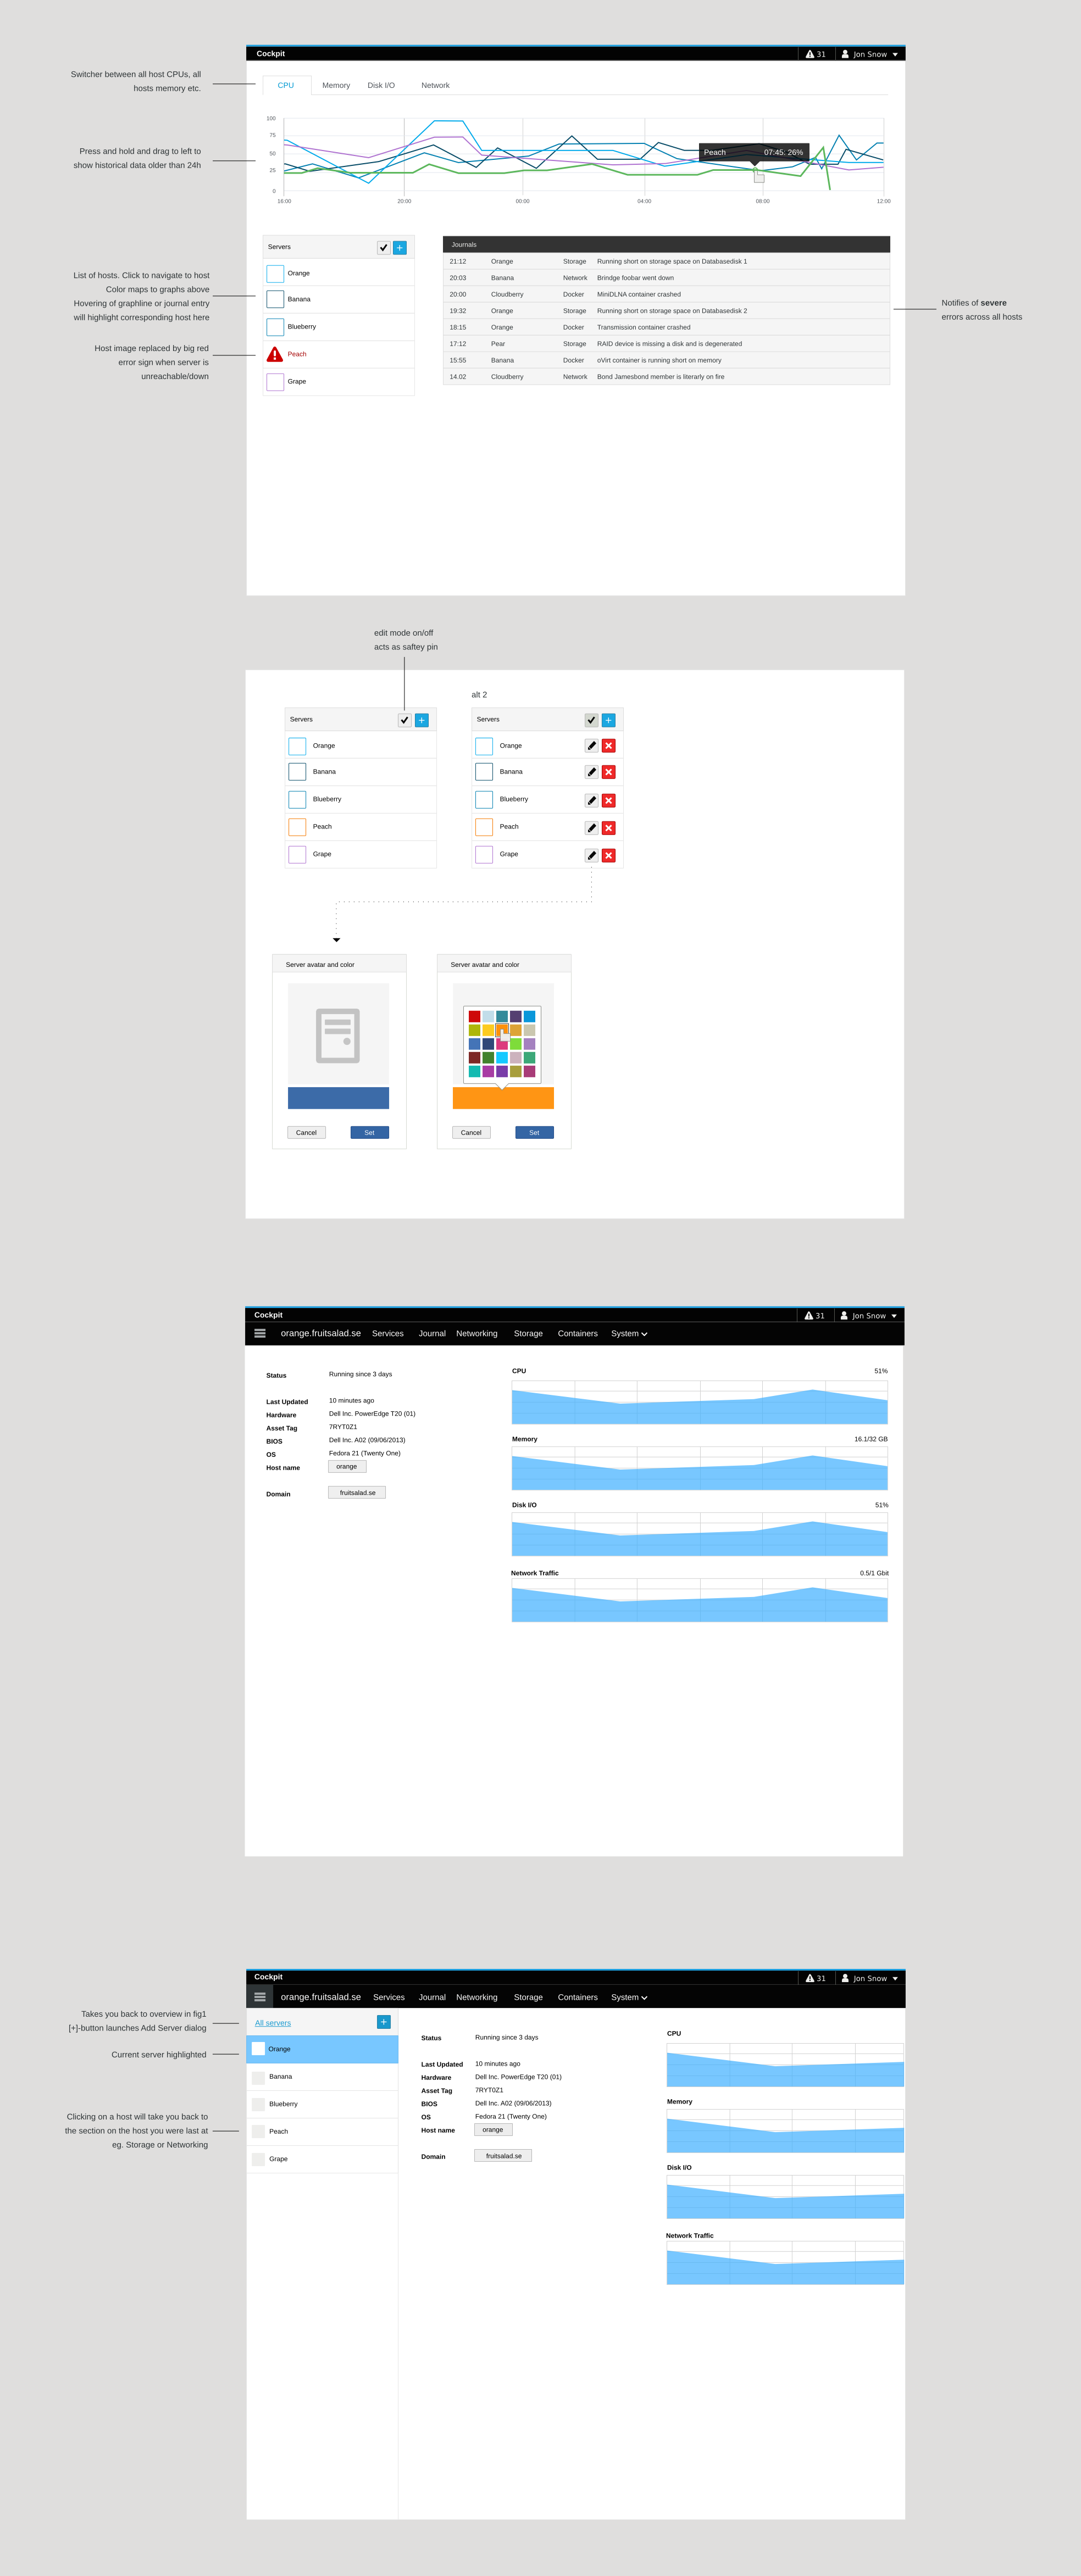
Cockpit Multi-Server Dashboard
Andreas and Marius have been working on implementing a new multi-server dash board for Cockpit. It’s really looking great.
The goal here is that the dash board should work with either one server or several, and give you an overview of what’s going on. Problems that require attention should be highlighted clearly. You should be able to click in spots to jump either to a server, a sub-system, a service/container/pod or to the source of a problem.
The graphs will be correlated across multiple machines, and draggable. Hopefully down road we’ll be using a source of data like PCP to gather the data more consistently. Problems will show up on the graphs as clickable. You can add and remove servers, and we want to show the state of important services/server applications/pods on those servers.
Once the basic code has landed, it would be good to tie this into Kubernetes as well. If running a Kubernetes cluster, and Cockpit is loaded on the master, we should use information from Kubernetes to populate the dashboard.
Here are some wireframes, click to expand:

